For two decades, Tracking Football has been studying the connection between football athleticism and track & field data. In that same time we have created 30,000 profiles of NFL/D1 football players that also did track and field in high school. This database has allowed us to create a proprietary algorithm that takes into account a football player’s height, weight, position, track and field data & multi-sport participation. The result is a 0.0 – 5.0 score we call the Player Athletic Index. Our PAI score is the basis of our NCAA compliant recruiting service which is used by FBS programs in the Big Ten and Big 12. We have over 7500 athletic profiles for high school football prospects
Since 2014 Tracking Football has applied our PAI score to the recruiting classes of all 129 FBS college football programs. In that time we have learned that approximately 80% of all D1 scholarship football players participated in multiple sports in high school, and roughly 55% did track & field. The following bowl game rankings are based on three years of recruiting class PAI average, number of athletes with PAI over 3.0 and track & field participation percentages of each bowl team.
For more bowl game information follow us on Twitter @TrckFootball and use #tfbowls.
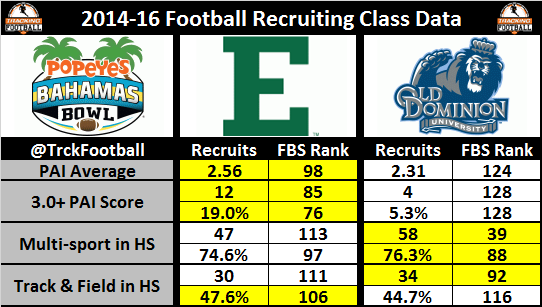
40. Eastern Michigan (#40) vs Old Dominion (#80)
- Multi-sport: 75.5%
- 2 Sports: 51.3%
- 3 Sports: 22.6%
- Track & Field: 46.2%
- Basketball: 38.5%
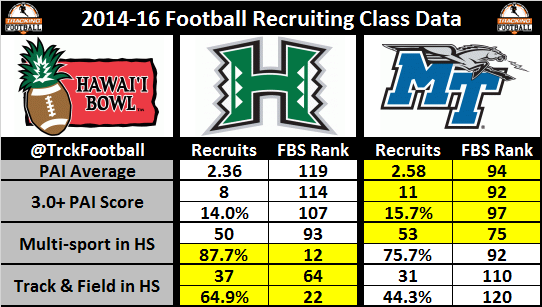
39. Hawaii (#76) vs Middle Tennessee (#64)
- Multi-sport: 81.7%
- 2 Sports: 58.0%
- 3 Sports: 20.5%
- Track & Field: 54.6%
- Basketball: 24.5%
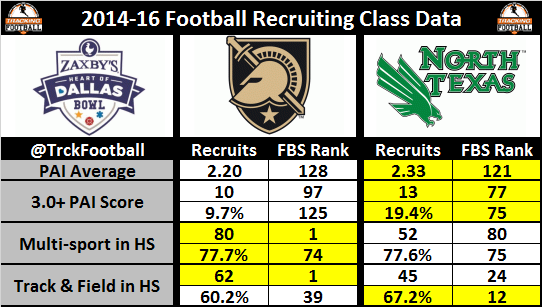
38. Army (#75) vs North Texas (#65)
- Multi-sport: 77.6%
- 2 Sports: 53.5%
- 3 Sports: 22.7%
- Track & Field: 63.7%
- Basketball: 24.4%
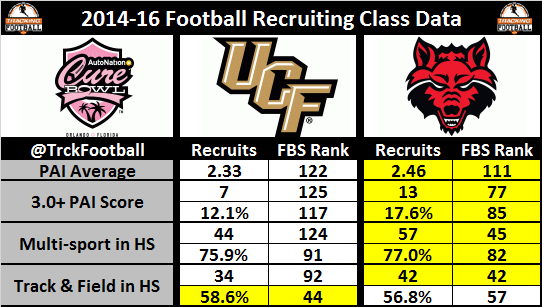
37. Central Florida (#78) vs Arkansas State (#60)
- Multi-sport: 76.4%
- 2 Sports: 47.7%
- 3 Sports: 27.0%
- Track & Field: 57.7%
- Basketball: 30.9%
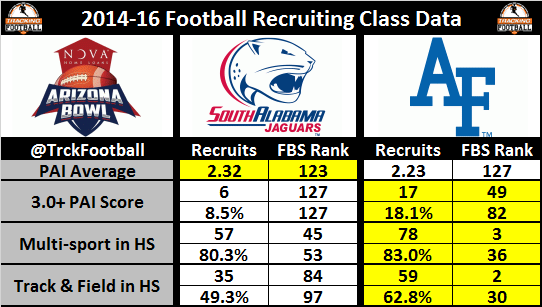
36. South Alabama (#79) vs Air Force (#58)
- Multi-sport: 81.6%
- 2 Sports: 56.2%
- 3 Sports: 22.4%
- Track & Field: 56.%
- Basketball: 24.0%
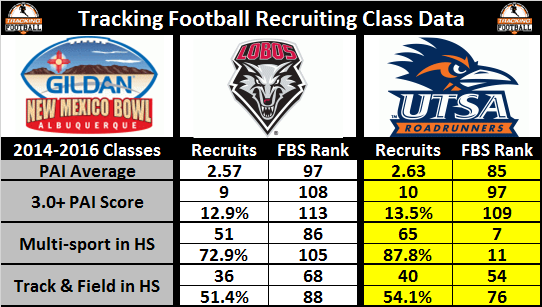
35. New Mexico (#71) vs UTSA (#61)
- Multi-sport: 80.3%
- 2 Sports: 59.4%
- 3 Sports: 20.3%
- Track & Field: 52.7%
- Basketball: 32.5%
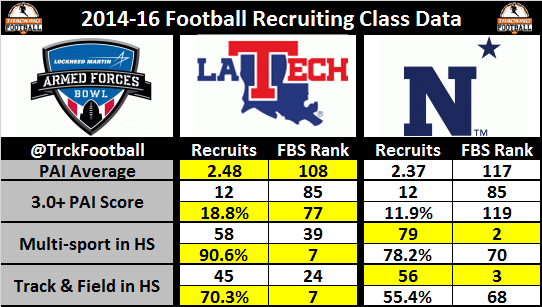
34. Louisiana Tech (#63) vs Navy (#68)
- Multi-sport: 84.4%
- 2 Sports: 54.1%
- 3 Sports: 25.6%
- Track & Field: 62.9%
- Basketball: 31.1%
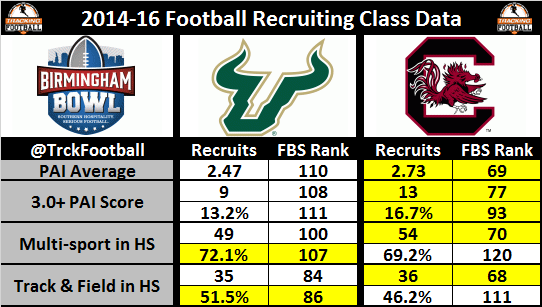
33. South Florida (#72) vs South Carolina (#52)
- Multi-sport: 70.6%
- 2 Sports: 49.5%
- 3 Sports: 20.6%
- Track & Field: 48.8%
- Basketball: 36.0%
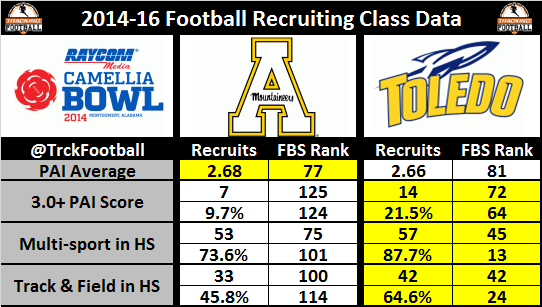
32. Appalachian State (#67) vs Toledo (#53)
- Multi-sport: 80.7%
- 2 Sports: 63.2%
- 3 Sports: 16.8%
- Track & Field: 55.2%
- Basketball: 30.0%
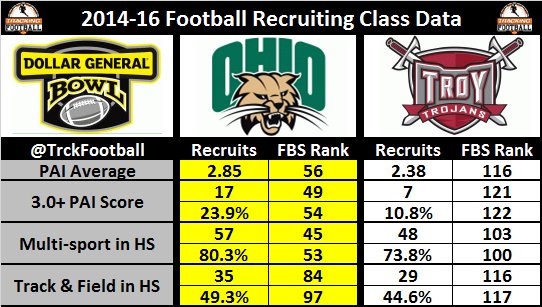
31. Ohio (#39) vs Troy (#77)
- Multi-sport: 80.3%
- 2 Sports: 52.1%
- 3 Sports: 22.2%
- Track & Field: 47.0%
- Basketball: 30.8%
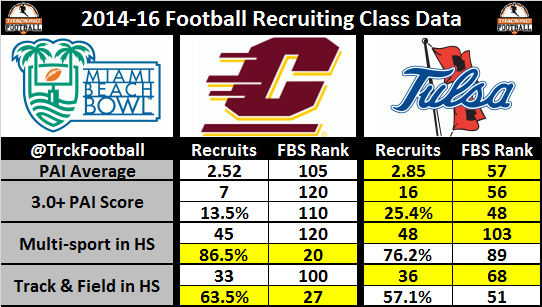
30. Central Michigan (#74) vs Tulsa (#45)
- Multi-sport: 81.4%
- 2 Sports: 51.0%
- 3 Sports: 25.9%
- Track & Field: 60.3%
- Basketball: 35.9%
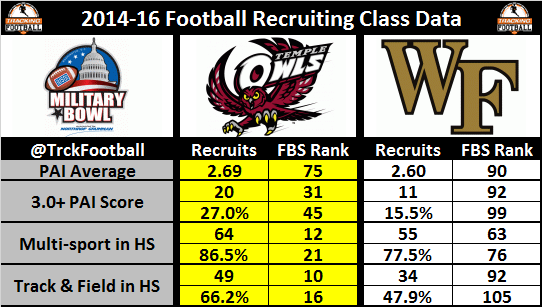
29. Temple (#40) vs Wake Forest (#59)
- Multi-sport: 82.0%
- 2 Sports: 55.2%
- 3 Sports: 24.1%
- Track & Field: 57.1%
- Basketball: 36.6%
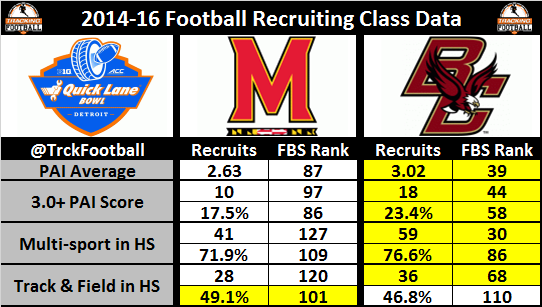
28. Maryland (#66) vs Boston College (#32)
- Multi-sport: 74.3%
- 2 Sports: 50.3%
- 3 Sports: 23.3%
- Track & Field: 47.9%
- Basketball: 27.4%
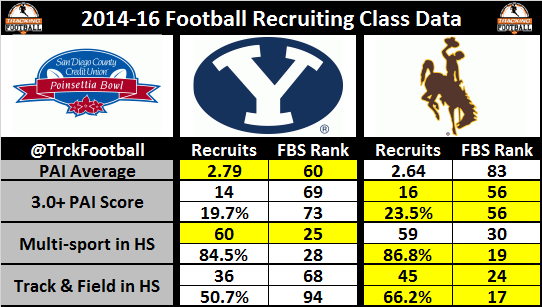
27. Brigham Young (#46) vs Wyoming (#50)
- Multi-sport: 85.6%
- 2 Sports: 55.3%
- 3 Sports: 28.1%
- Track & Field: 58.4%
- Basketball: 38.9%
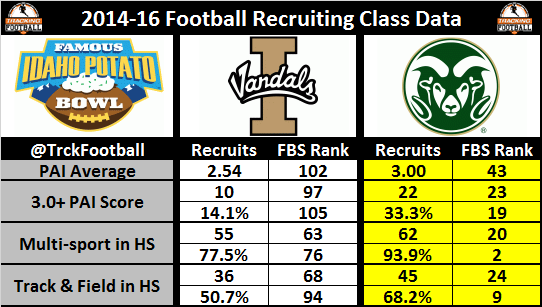
26. Idaho (#69) vs Colorado State (#26)
- Multi-sport: 93.9%
- 2 Sports: 54.9%
- 3 Sports: 30.0%
- Track & Field: 59.4%
- Basketball: 32.2%
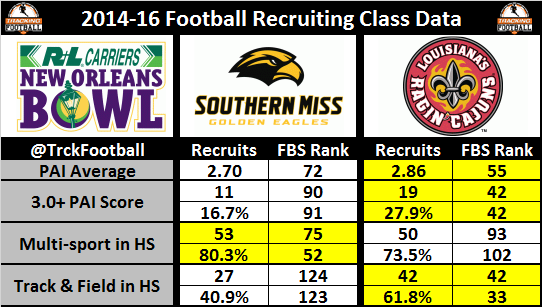
25. Southern Mississippi (#54) vs Louisiana-Lafayette (#39)
- Multi-sport: 76.9%
- 2 Sports: 53.7%
- 3 Sports: 20.9%
- Track & Field: 51.3%
- Basketball: 31.5%
24. Miami-Ohio (#70) vs Mississippi State (#17)
- Multi-sport: 74.8%
- 2 Sports: 41.1%
- 3 Sports: 28.8%
- Track & Field: 53.6%
- Basketball: 40.5%

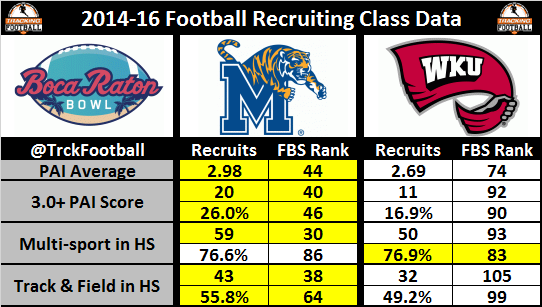
23. Memphis (#30) vs Western Kentucky (#57)
- Multi-sport: 76.8%
- 2 Sports: 53.3%
- 3 Sports: 21.6%
- Track & Field: 52.5%
- Basketball: 32.9%
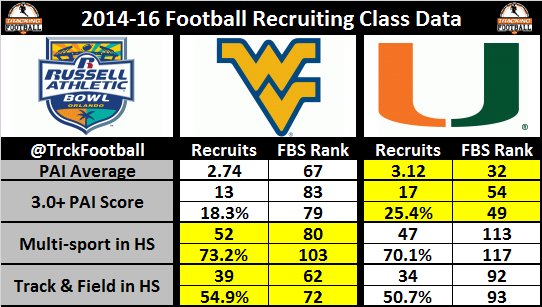
22. West Virginia (#51) vs Miami-Florida (#35)
- Multi-sport: 71.7%
- 2 Sports: 55.7%
- 3 Sports: 16.0%
- Track & Field: 52.8%
- Basketball: 26.9%
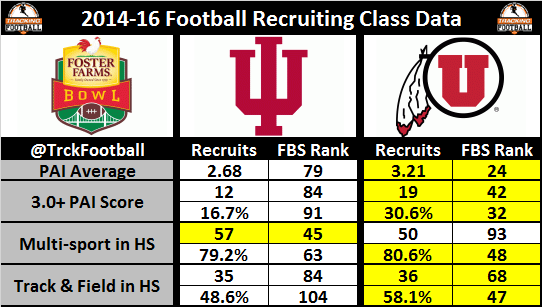
21. Indiana (#56) vs Utah (#27)
- Multi-sport: 79.9%
- 2 Sports: 47.1%
- 3 Sports: 30.5%
- Track & Field: 53.3%
- Basketball: 42.5%
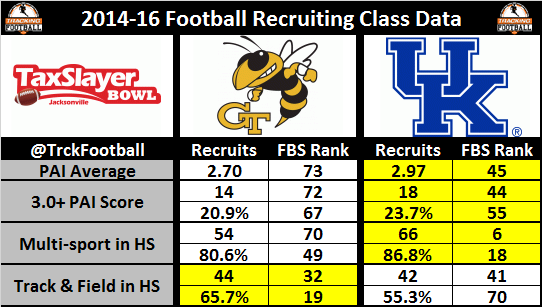
20. Georgia Tech (#47) vs Kentucky (#36)
- Multi-sport: 83.7%
- 2 Sports: 51.4%
- 3 Sports: 30.1%
- Track & Field: 60.5%
- Basketball: 38.4%
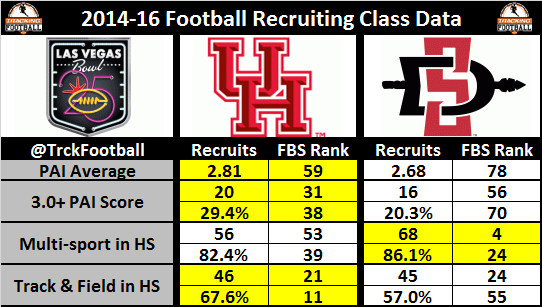
19. Houston (#34) vs San Diego State (#49)
- Multi-sport: 84.2%
- 2 Sports: 54.6%
- 3 Sports: 27.0%
- Track & Field: 62.3%
- Basketball: 37.5%
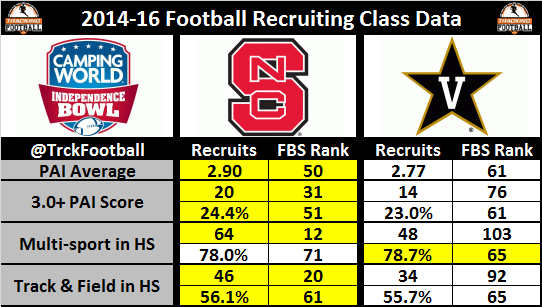
18. NC State (#33) vs Vanderbilt (#48)
- Multi-sport: 78.4%
- 2 Sports: 46.7%
- 3 Sports: 29.4%
- Track & Field: 55.9%
- Basketball: 36.6%
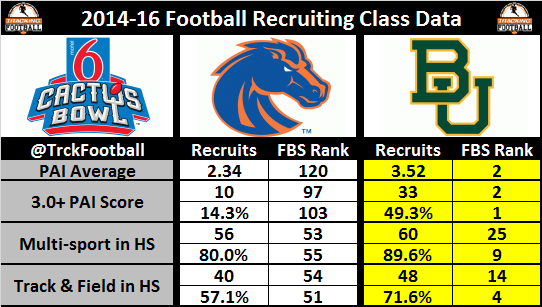
17. Boise State (#73) vs Baylor (#1)
- Multi-sport: 84.8%
- 2 Sports: 59.0%
- 3 Sports: 24.3%
- Track & Field: 64.4%
- Basketball: 30.9%
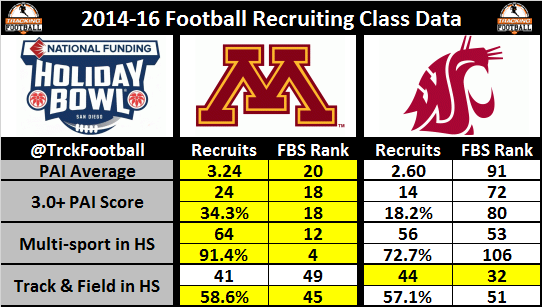
16. Minnesota (#16) vs Washington State (#55)
- Multi-sport: 82.1%
- 2 Sports: 54.6%
- 3 Sports: 25.4%
- Track & Field: 57.9%
- Basketball: 34.4%
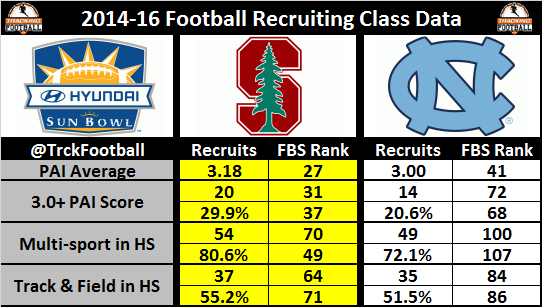
15. Stanford (#25) vs North Carolina (#43)
- Multi-sport: 76.3%
- 2 Sports: 47.4%
- 3 Sports: 26.7%
- Track & Field: 53.3%
- Basketball: 34.1%
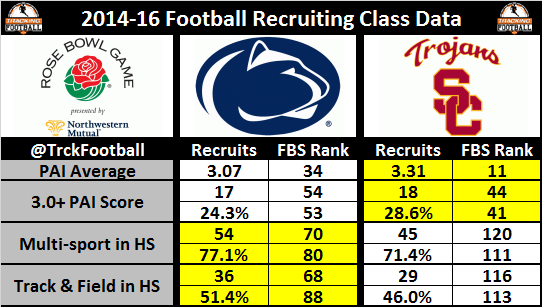
14. Penn State (#37) vs Southern California (#23)
- Multi-sport: 74.3%
- 2 Sports: 46.9%
- 3 Sports: 23.7%
- Track & Field: 48.7%
- Basketball: 41.1%
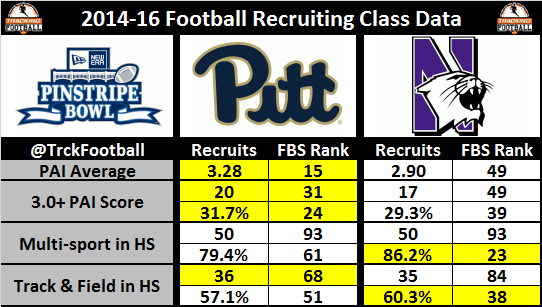
13. Pittsburgh (#19) vs Northwestern (#41)
- Multi-sport: 82.8%
- 2 Sports: 52.1%
- 3 Sports: 28.2%
- Track & Field: 58.7%
- Basketball: 43.0%
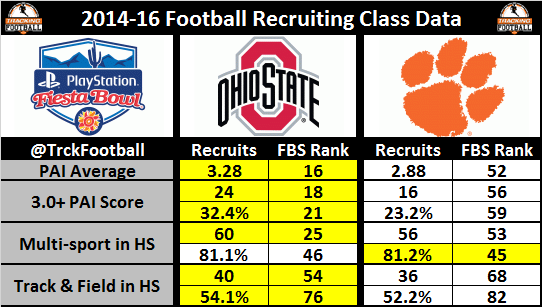
12. Ohio State (#15) vs Clemson (#44)
- Multi-sport: 81.1%
- 2 Sports: 53.8%
- 3 Sports: 25.2%
- Track & Field: 53.1%
- Basketball: 41.4%
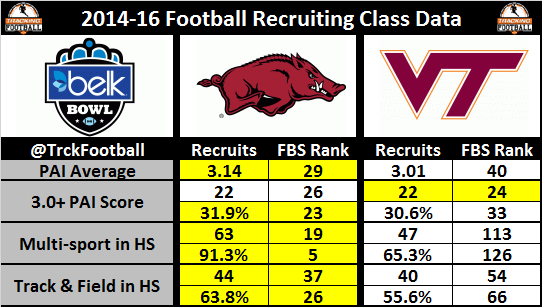
11. Arkansas (#20) vs Virginia Tech (#24)
- Multi-sport: 78.3%
- 2 Sports: 45.4%
- 3 Sports: 30.0%
- Track & Field: 59.7%
- Basketball: 41.4%
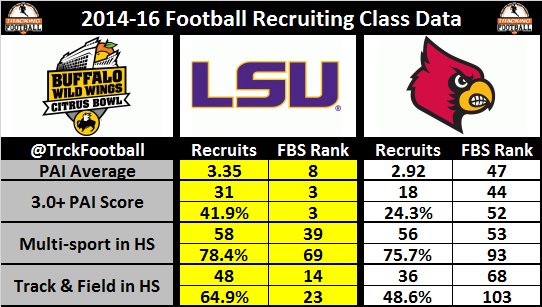
10. LSU (#4) vs Louisville (#38)
- Multi-sport: 77.0%
- 2 Sports: 75.7%
- 3 Sports: 52.7%
- Track & Field: 56.8%
- Basketball: 34.5%
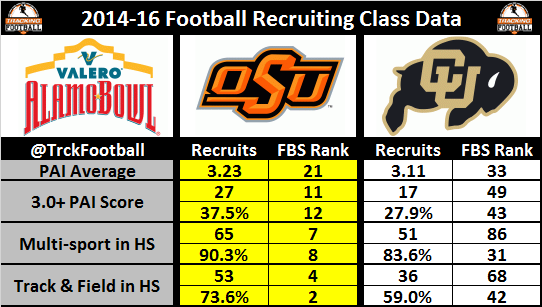
9. Oklahoma State (#9) vs Colorado (#31)
- Multi-sport: 86.9%
- 2 Sports: 52.2%
- 3 Sports: 31.2%
- Track & Field: 66.3%
- Basketball: 36.4%
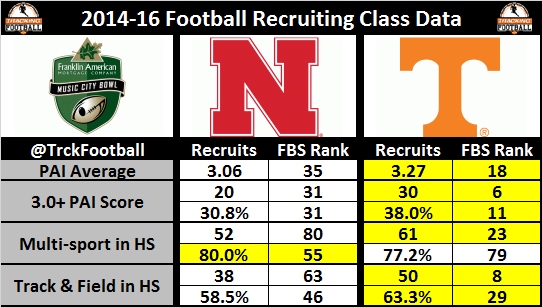
8. Nebraska (#29) vs Tennessee (#8)
- Multi-sport: 78.6%
- 2 Sports: 53.0%
- 3 Sports: 25.6%
- Track & Field: 60.9%
- Basketball: 31.2%
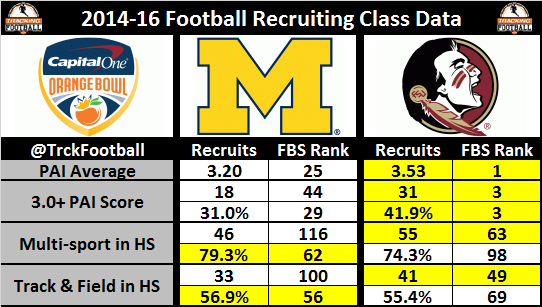
7. Michigan (#28) vs Florida State (#3)
- Multi-sport: 76.8%
- 2 Sports: 51.8%
- 3 Sports: 23.3%
- Track & Field: 56.2%
- Basketball: 36.4%
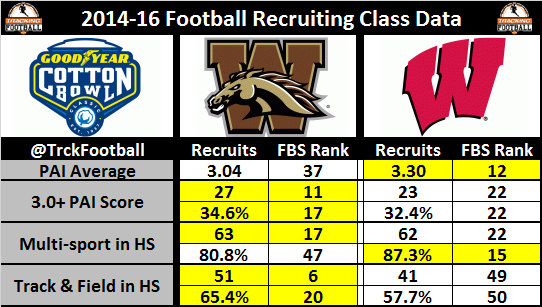
6. Western Michigan (#18) vs Wisconsin (#11)
- Multi-sport: 84.0%
- 2 Sports: 60.3%
- 3 Sports: 21.0%
- Track & Field: 61.6%
- Basketball: 31.8%
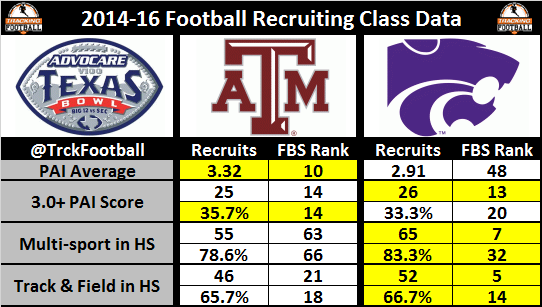
5. Texas A&M (#7) vs Kansas State (#22)
- Multi-sport: 81.0%
- 2 Sports: 43.9%
- 3 Sports: 33.7%
- Track & Field: 66.2%
- Basketball: 39.9%
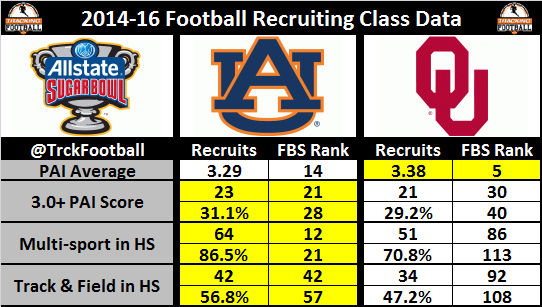
4. Auburn (#12) vs Oklahoma (#14)
- Multi-sport: 78.7%
- 2 Sports: 55.5%
- 3 Sports: 21.2%
- Track & Field: 52.0%
- Basketball: 34.1%
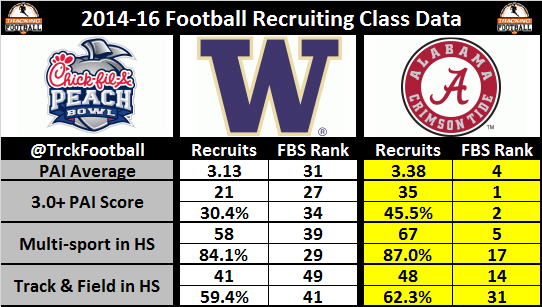
3. Washington (#21) vs Alabama (#2)
- Multi-sport: 85.5%
- 2 Sports: 60.2%
- 3 Sports: 24.6%
- Track & Field: 60.9%
- Basketball: 39.6%
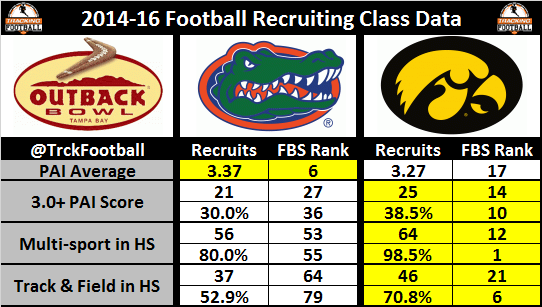
2. Florida (#13) vs Iowa (#10)
- Multi-sport: 89.2%
- 2 Sports: 56.9%
- 3 Sports: 23.1%
- Track & Field: 61.8%
- Basketball: 43.4%
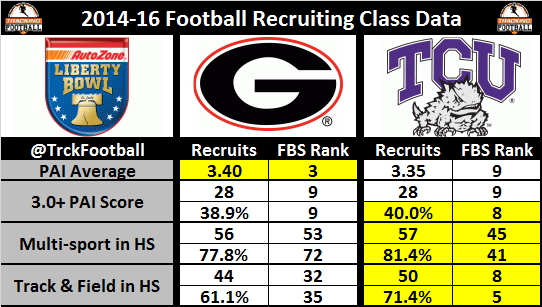
1. Georgia (#5) vs TCU (#6)
- Multi-sport: 79.6%
- 2 Sports: 52.9%
- 3 Sports: 25.3%
- Track & Field: 66.3%
- Basketball: 32.3%