Each year Bruce Feldman assembles a college football “Freaks List” based on their physical athletic abilities. Coaches, players and sports information directors assist Feldman in this compilation and many in the football community anticipate the release of this article. This year the staff at Tracking Football decided to provide a few overall insights using our high school athletic data and analytics of these players as prospects.
Multiple Sport Participation
We found that 45 of the 50 ‘Feldman Freaks’ played another sport in addition to football during high school. Below is the complete participation breakdown by sport and number of sports played:
Sport
Track & Field: 76%
Basketball: 38%
Wrestling: 6%
Baseball: 4%
Other: 8%
Number of sports
4 sports: 4%
3 sports: 34%
2 sports: 52%
Specialist: 10%
Player Athletic Index:
Tracking Football is able to provide a deeper context to the height, weight, speed, power relationship these athletes exhibited in high school because of the high percentage of track & field athletic backgrounds (76%). Track & field data is historic, standardized and universal and our database allows college/NFL personnel departments to identify, verify and compare the athleticism of past and present football players
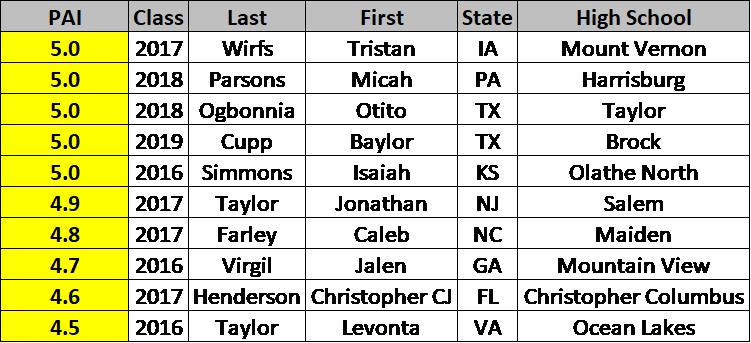
Our Player Athletic Index (PAI) is designed to objectively indicate Division I-level football athleticism, and is based on verified information from our database of over 35,000 Division I players. The average DI signee (FBS/FCS) is slightly above a 2.5/5.0 PAI, however the average NFL Draft pick is over 3.5/5.0 PAI. Less than 2% of all DI prospects in our database have achieved a perfect rating of 5.0/5.0. Below is a summary of how the “Freaks” rated on our PAI score in high school.
Average “Freak” PAI Score = 3.7/5.0
5.0/5.0: 10%
4.0-4.9: 24%
3.0-3.9: 18%
2.0-2.9: 18%
1.0-1.9: 2%
0.0-0.9: 0%
T&F Event Performance Lists
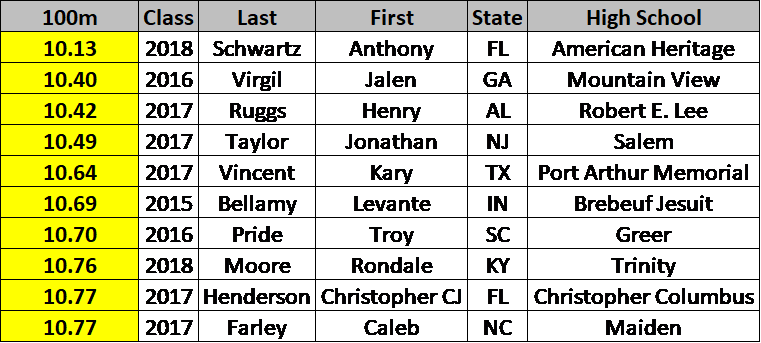
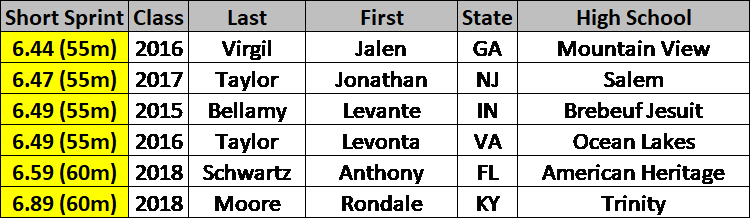
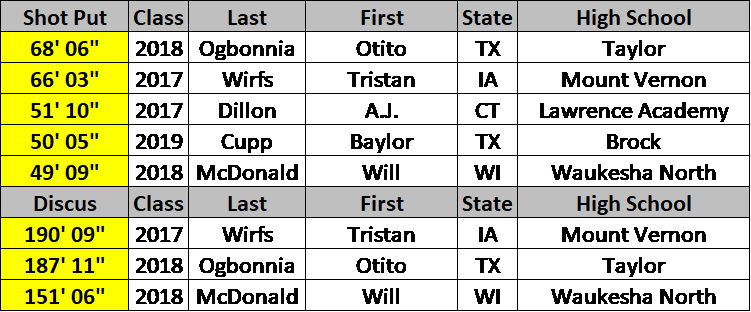
While many understand the connection sprint data has with skill positions, they tend to underestimate the relevance of field data, and misunderstand how to analyze T&F results on a position specific basis. Our database allows CFB personnel to calibrate the football specific context they apply to these results. Below is a breakdown of the most popular track & field events the “Freaks” performed.
100m: 52%
4×100: 46%
200m: 42%
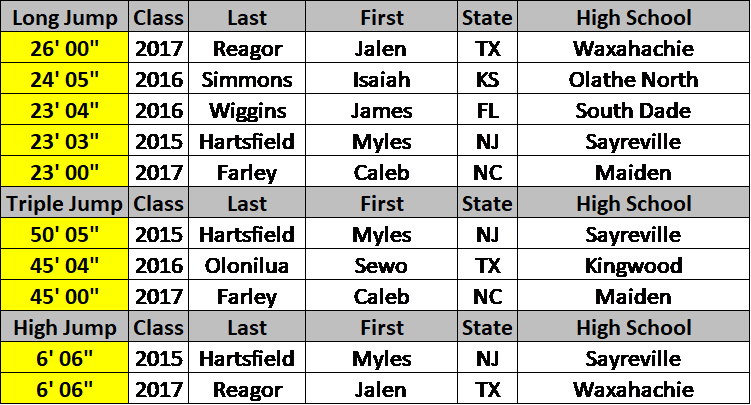
Long Jump: 24%
Discus: 22%
Shot Put: 20%

Football evaluators know that athleticism is not an end-all-be-all aspect in the scouting process, however it is a very important piece in the puzzle. Tracking Football analytics derived from high school track & field data are proven to assist football personnel in making more well-informed decisions on prospects. Many “Freaks List” members showcased their outstanding athleticism as high school preps and Tracking Football has developed the tools to identify, verify and compare them.