Every year the staff at Tracking Football researches recruiting class information for all FBS & FCS teams. We track a variety of basic information on prospects such as; location, position, height, weight, star rating and scholarship offers. In addition we document athletic background metrics such as; multi-sport participation, track & field performance and combine event data. Once our raw data research is complete, we are able to generate our proprietary analytics like the PAI Score, Combine Score & D1 percentile comparisons.
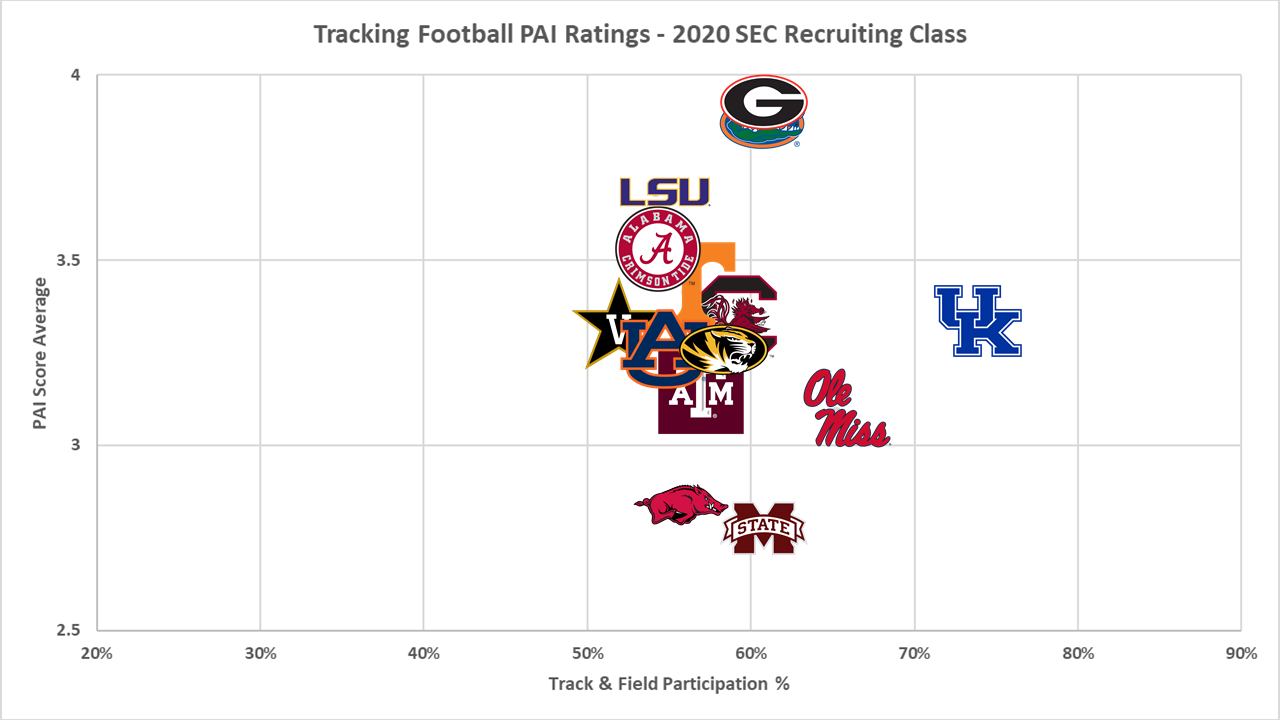
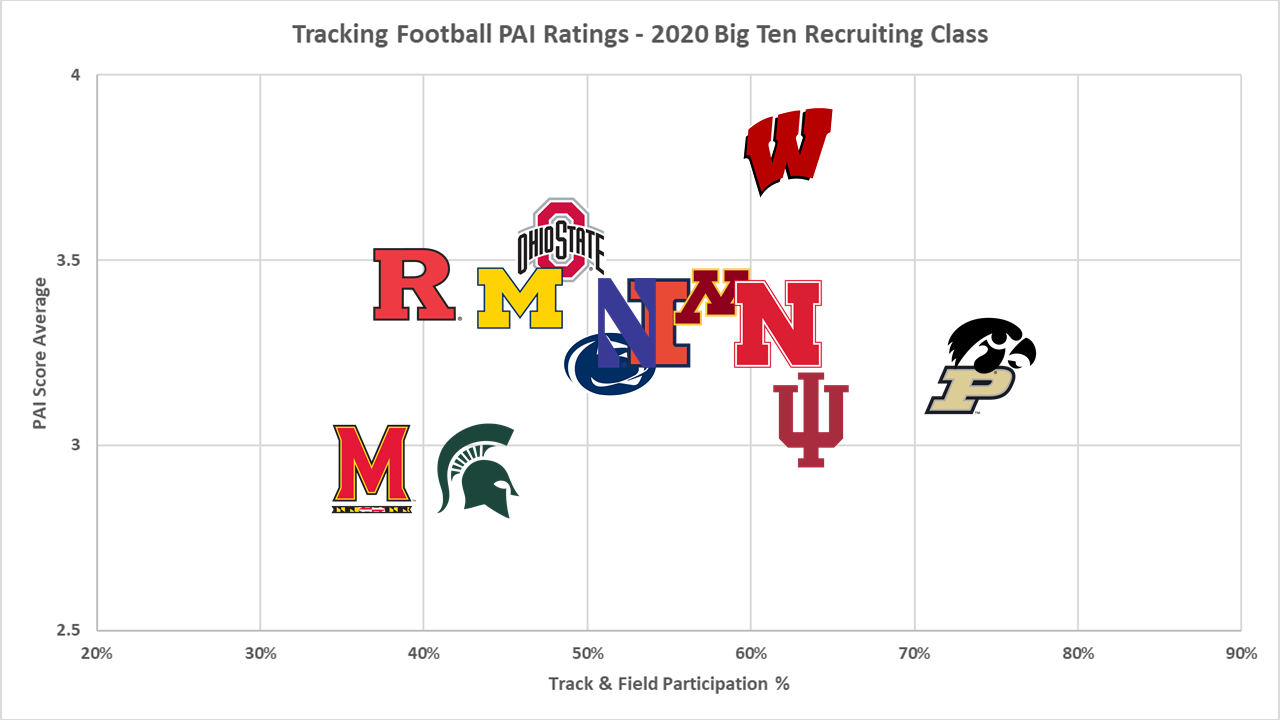
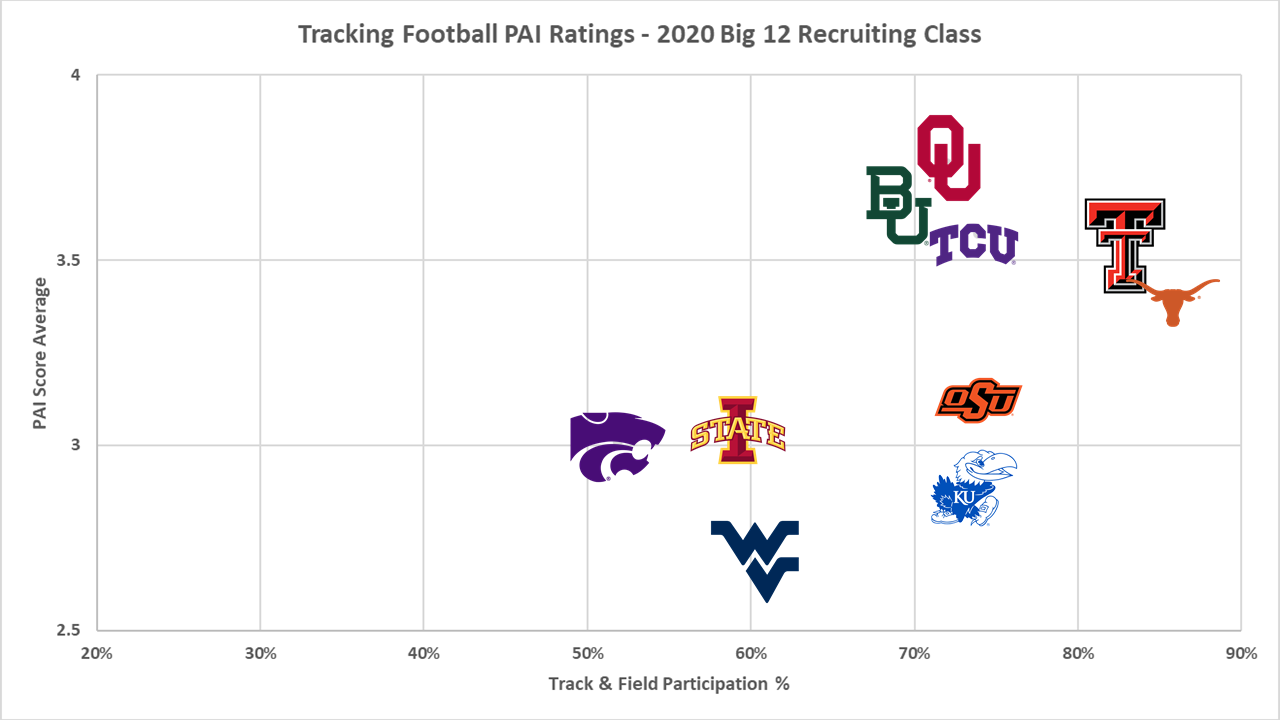
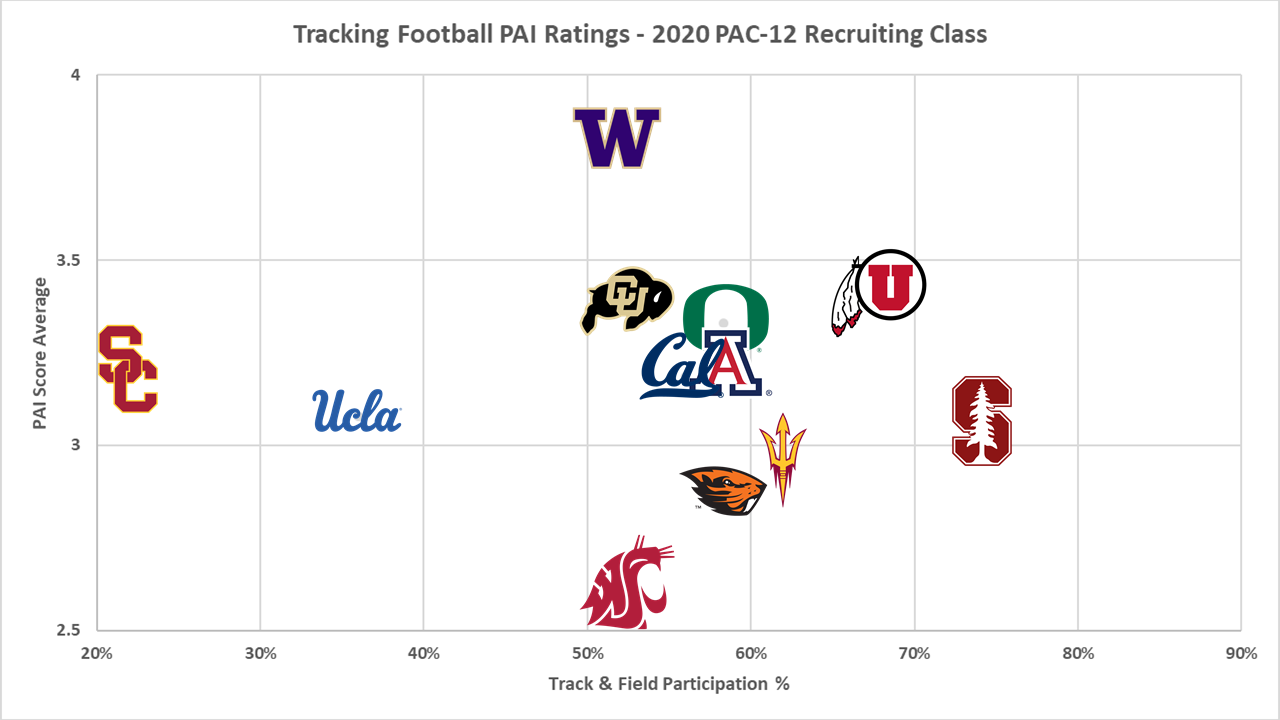
Below are some data visualizations I created to display our PAI ratings for all Power 5 conference teams. The PAI team average is on the Y axis and the track & field participation average is on the X axis.
SEC – 3.4/5.0 PAI Average – 59% T&F Participation
B1G – 3.3/5.0 PAI Average – 54% T&F Participation
XII – 3.3/5.0 PAI Average – 70% T&F Participation
PAC – 3.2/5.0 PAI Average – 55% T&F Participation
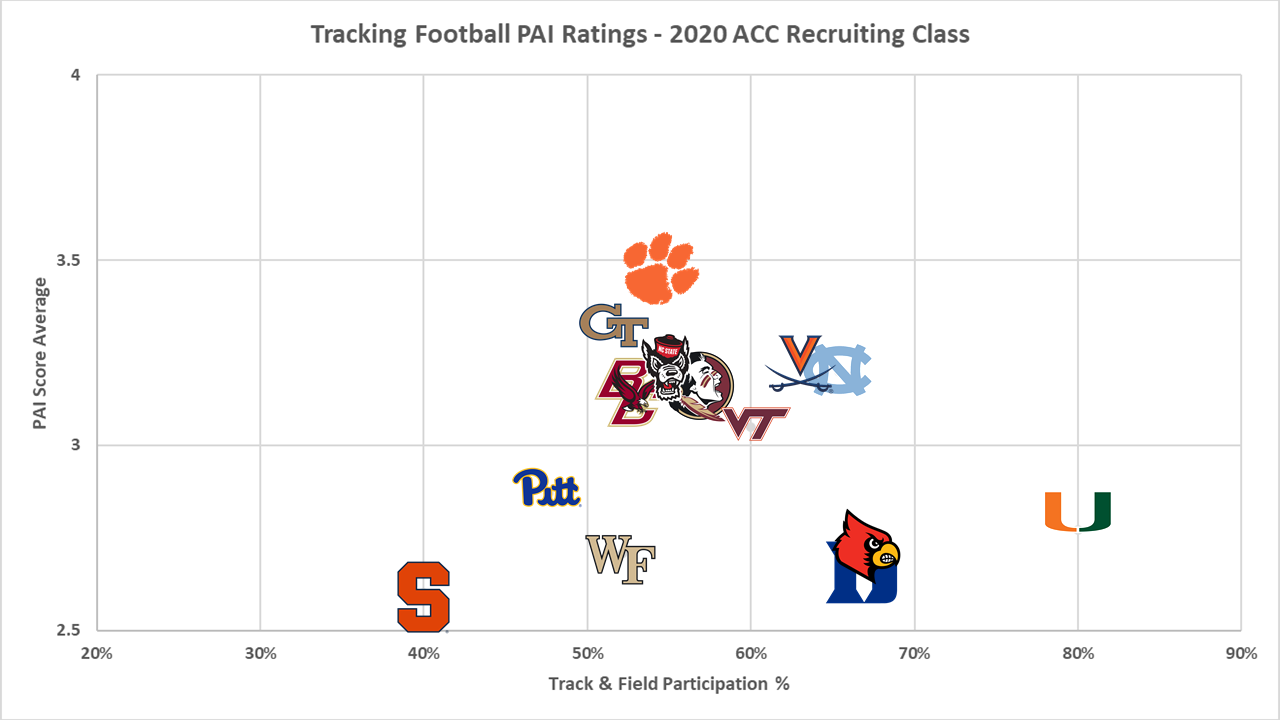
ACC – 3.0/5.0 PAI Average – 58% T&F Particpation
If you would like to learn more about the ways we are innovating football talent evaluation please request a demo with one of our staff members.